Insights
The monthly marketing report, torn down: where the days go, and how to redesign it
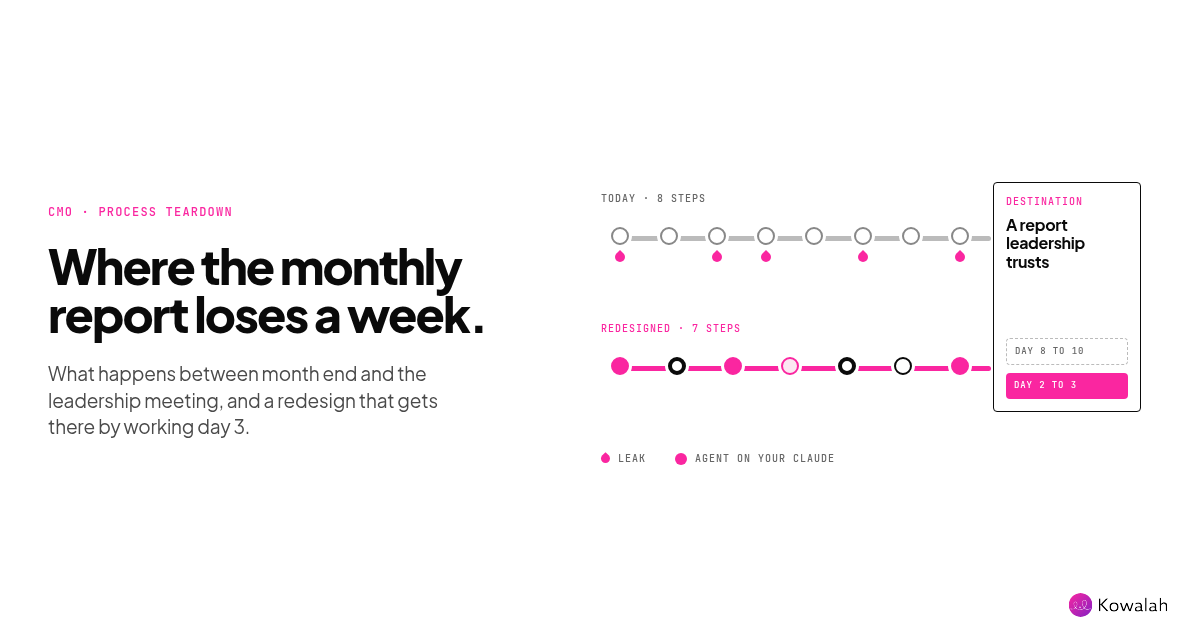
The monthly marketing report is how a CMO shows the leadership team what marketing contributed to revenue. A common version runs to eight steps, six roles and eight to ten working days after the month closes.
This teardown walks through those steps, the places time and trust tend to fall away, and a redesigned process. An agent built on your own Claude does the pulling, matching and first draft, and your team makes the judgement calls.
This is a process teardown: one revenue process, before and after. The numbers are illustrative, built on a marketing team of about 30 people running paid, events, email and content. They are not a client result.
The goal: show marketing's contribution, every month
Why it matters: the pressure to prove marketing's value comes from the top. In The CMO Survey 2026 of 308 US marketing leaders, 59% reported increasing pressure from the CEO to prove the value of marketing, and 56% from the CFO. The most common response, from 86.3%, was to develop stronger marketing performance tracking.
The goal is a monthly view of marketing's contribution that the leadership team trusts and acts on: the pipeline and revenue marketing sourced or influenced, against target, with the decisions it implies.
The KPI that shows the process is working is days to a trusted report: working days from month end to a report the leadership team accepts without disputing the numbers. Two companions keep it honest:
- Number of figures challenged or corrected after the report goes out
- Decisions taken from the report, such as budget moved between channels
Today's process
Here is a common version, after the illustrative team's month end:
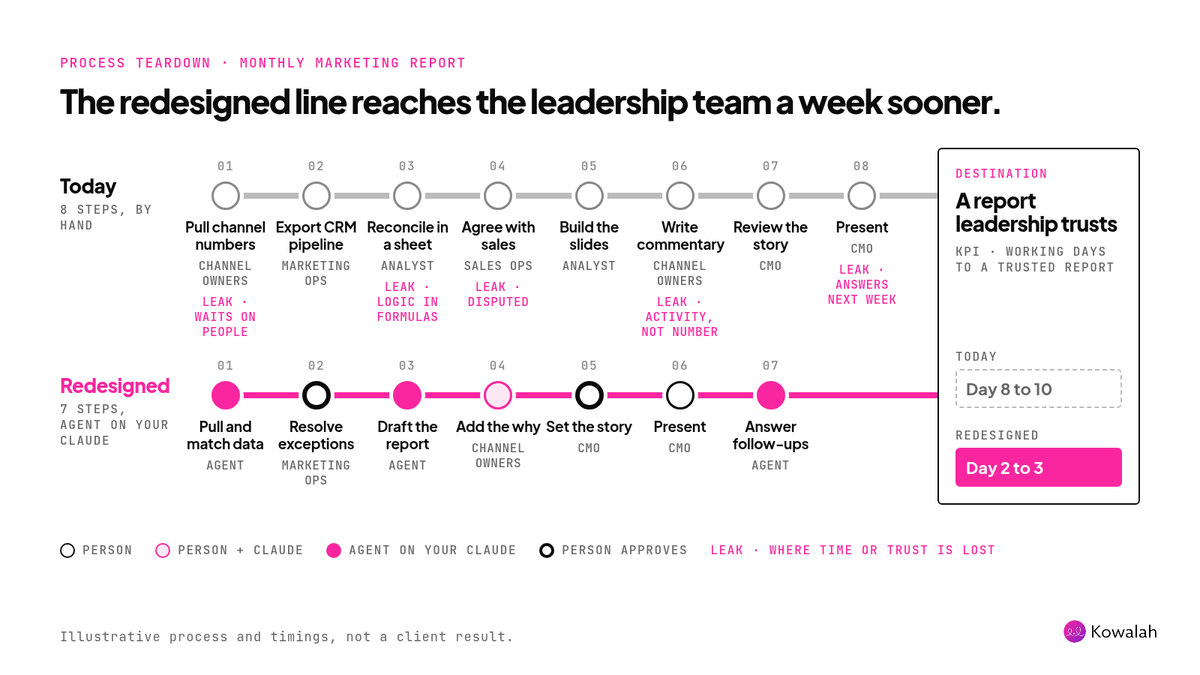
- Pull channel numbers (channel owners, working days 1 to 3). Paid, social, email and events each export from their own platform: Google Ads, LinkedIn Campaign Manager, GA4, the marketing automation tool. Each lands in a different tab of a shared spreadsheet, in a different format.
- Export pipeline from the CRM (marketing ops, about 2 hours). An opportunity report from Salesforce or HubSpot, with lead source and campaign.
- Reconcile in a spreadsheet (marketing analyst, about 6 hours). Matching campaigns to opportunities, fixing campaign names that changed mid-quarter, chasing missing tracking codes, and working out why GA4 and the CRM disagree.
- Agree the numbers with sales (marketing ops and sales ops, about 3 hours across several calls). Who sourced the deal, and does an event touch count as influence.
- Build the charts and slides (marketing analyst, about 4 hours). Copied into last month's deck template.
- Write the commentary (channel owners, about 4 hours in total). What happened and why, channel by channel.
- Review and rewrite the story (CMO, about 2 hours). Cutting activity, adding the so-what.
- Present to the leadership team (CMO). Questions that need new cuts of the data go on a list for later.
That's about 25 hours of people's time, and eight to ten working days before the leadership team sees last month. When a figure is disputed, it slips again.
Where it leaks
The data waits on people. Most of the first week goes on waiting: for each channel owner to find time for an export, and for the analyst to get to the tab. The work itself takes hours. The elapsed time takes days.
How many working days after month end did your leadership team see last month's numbers?
Sales and marketing count the same deal differently. The rep who created the opportunity picked a lead source from a drop-down, sometimes "Other". Marketing sees the webinar and two events in the contact's history. Sales sees a deal the rep found. Neither is wrong, and each team has a reason to count it their way. The result is a meeting about whose number is right instead of what to do next.
When did sales and marketing last agree, in writing, what "marketing-sourced" and "influenced" mean?
The spreadsheet holds the logic. The rules for matching campaigns to opportunities live in one analyst's formulas. When that person is on holiday or leaves, the report slows down or changes shape.
Could someone else produce this month's report from your written definitions alone?
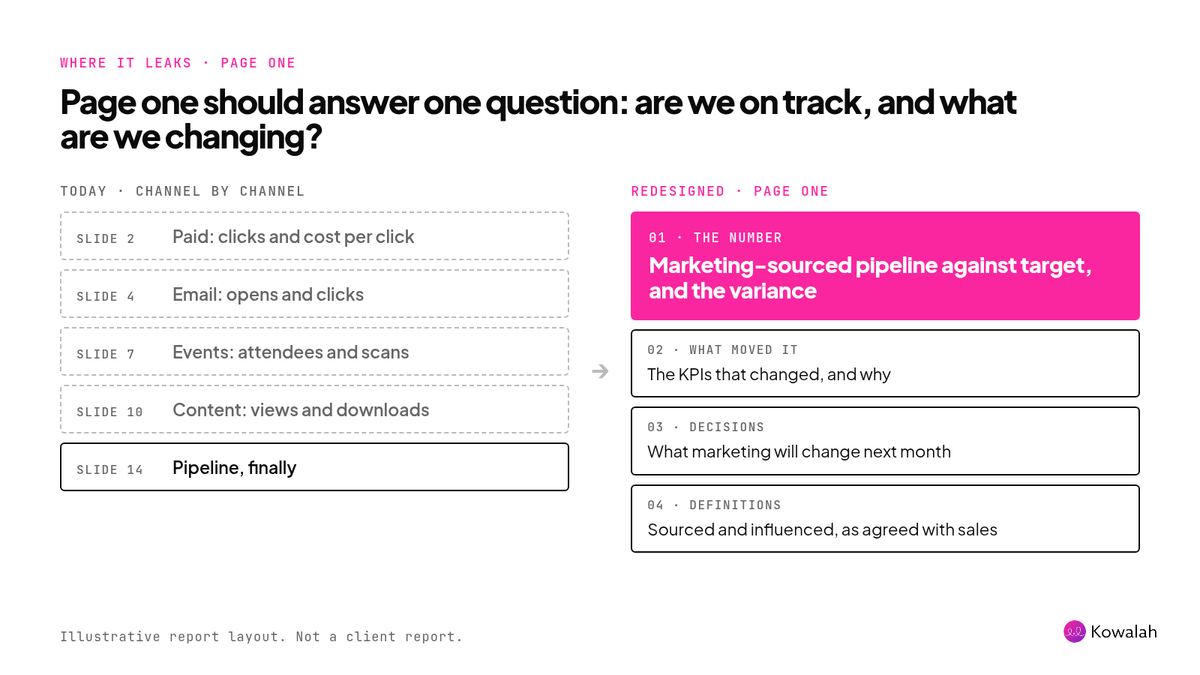
The report describes activity, not the number. Eight channel sections of clicks, opens and attendees, then pipeline on slide 14. The leadership team wants to know whether marketing is on track for the target, and what you will change.
Does page one of your last report answer "are we on track, and what are we changing"?
Follow-up questions restart the cycle. "What did the events contribute last quarter?" goes on a list, and the answer arrives a week later, after the decision it was meant to inform.
How many questions from your last leadership meeting were answered within a day?
The redesigned process
The redesign starts from the goal, not the tools. Each step gets the cheapest thing that does it well: a person, a skill in Claude, or an agent. The sequence below is an example of what can be built on your own Claude account, not a product we sell. A reporting agent takes the routine steps, and your team keeps the judgement calls.
- Pull and match the data (agent, working day 1). The agent reads the CRM, web analytics and ad platforms through connectors, applies the definitions you agreed with sales, and builds the month's figures in a consistent format.
- Resolve the exceptions (marketing ops). The agent lists what it couldn't match: opportunities with no campaign, spend with no tracking code, figures that changed since last month. A person decides each one. The rules stay written down, not hidden in a formula.
- Draft the report (agent). Page one leads with the number against target and the variance, then the KPIs that moved it, then the questions the data raises. Charts are built from the same figures every month.
- Add the why (channel owners, working with Claude). Each owner adds what the data can't show: the campaign that launched late, the event that moved, the creative that's tiring.
- Set the story and the decisions (CMO). The CMO decides what the leadership team needs to hear and what marketing will change.
- Present to the leadership team (CMO). Unchanged, except the numbers arrive agreed.
- Answer follow-up questions (agent). New cuts of the same data come back within hours, from the same definitions, for the CMO to check and send.
Eight steps become seven. Three run on the agent, one is a person working with Claude, and three stay with people by design: the exceptions, the story and the room.
| Today | Redesigned | |
|---|---|---|
| Days to a trusted report | Working day 8 to 10 | Working day 2 to 3 |
| Where the matching rules live | One analyst's spreadsheet | Written definitions the agent applies |
| Sales and marketing definitions | Argued each month | Agreed once, reviewed each quarter |
| Page one | Channel activity | The number, the variance, the decisions |
| Follow-up questions | Answered next week | Answered within hours |
| People's time per month | About 25 hours | About 8 hours, mostly judgement |
What the agent needs: read access to your CRM (Salesforce or HubSpot), web analytics and ad platforms, your definitions of sourced and influenced, last month's report as a model, and your target. It runs on your own Claude and Anthropic account, so you own it and see what it costs each day. It starts read-only, and people approve what goes to the leadership team.
One more thing it doesn't do: replace your attribution model. It applies the rules you choose, consistently, every month. Choosing them is still a conversation between marketing, sales and finance.
The KPI to watch, and how to measure it
Baseline first. Before you change anything, write down four numbers from your last three monthly reports:
- Working days from month end to the report the leadership team accepted
- Figures challenged or corrected after it went out
- People's hours spent on it, by role (a quick survey is enough)
- Follow-up questions, and how long each took to answer
Then compare. Run the next two month ends on the redesigned process and read the same four numbers. Record the baseline and each reading against the goal, so the leadership team sees the KPI move, not a list of tasks.
Watch quality as well as speed. Check the agent's figures against the old spreadsheet for the first two months. A faster wrong number is worse than a slow right one.
Where to start
Start with the definitions. Get marketing, sales and finance to agree in writing what "sourced" and "influenced" mean, which date rules apply and which stage counts as pipeline. That's useful whether or not you add an agent, and the agent can't apply rules nobody has written down. The free Monthly Marketing Report Template has a page for the definitions, a one-page report layout and a worksheet to map your own process.
It's a common gap. In Gartner's 2026 CMO Spend Survey of 401 marketing leaders in North America, the UK and Europe, 70% said their internal marketing processes were not yet mature enough to implement and scale AI.
We're a UK Anthropic Implementation Specialist. We work with CMOs to redesign processes like this one against the KPI they move, then build the agents with your team on your own Claude account. A first step can be an AI Baseline, which measures where your team's time goes today, or an Agent Pilot: one agent on one bottleneck, measured against a baseline.
Talk it through first
Book a free 45-minute planning session. Bring last month's report and the date it went out, and leave with the redesigned process and the KPI to watch. Book a planning session, or see how we work with CMOs.
Enjoyed this?
Weekly insights for executives navigating enterprise AI. A five-minute read.