Insights
Claude smart reports: what they show, and where they stop
Claude Enterprise can now tell you what your teams actually use it for. Smart reports, in beta since September 2026, read a sample of one team's Claude sessions and report the work it did, what that work cost, where it got stuck, and which repeated jobs are worth turning into a shared skill.
This guide is for the CIO, AI Ops lead or Claude admin who owns an Enterprise seat count and needs a better answer to "what did we get for it" than a login chart.
The short answer
- What it is: a report on how one team uses Claude: the work, the cost, the friction and the skills worth building.
- Who gets it: Claude Enterprise organisations. Owners, Admins and custom roles with analytics access can run one.
- Limits: 10 free reports per organisation per month during the beta, each covering up to the last 28 days.
- Best for: deciding where your next AI pound goes. Not for: billing, or judging individuals.
Why it matters
Most companies can tell you how many Claude seats they've bought. Almost none can tell you what those seats are doing, or which teams deserve more.
Active users and message counts measure reach, not value. They tell you who turned up, not what changed. Smart reports are the first built-in view of the work itself: what people used Claude for, what it produced, and where the money went.
How a smart report works
- Turn it on. A Primary Owner or Owner enables Smart reports (beta) under Organization settings, Capabilities, Analytics. An optional attribution setting controls whether viewers can see who ran a session. Every name reveal is logged.
- Choose the scope. Pick a team (a group, or a department or cost centre sent through SCIM), a date range of up to 28 days, the products (chat, Claude Code or Cowork), focus areas and any custom questions.
- Claude does the reading. It samples transcripts, groups them into workstreams and types of output, attaches spend to each group and writes up the findings.
- Get the report. It takes a few hours and you're emailed when it's ready. Charts are interactive, you can download the report as HTML, and you share it with named people through a link.
What's in a report
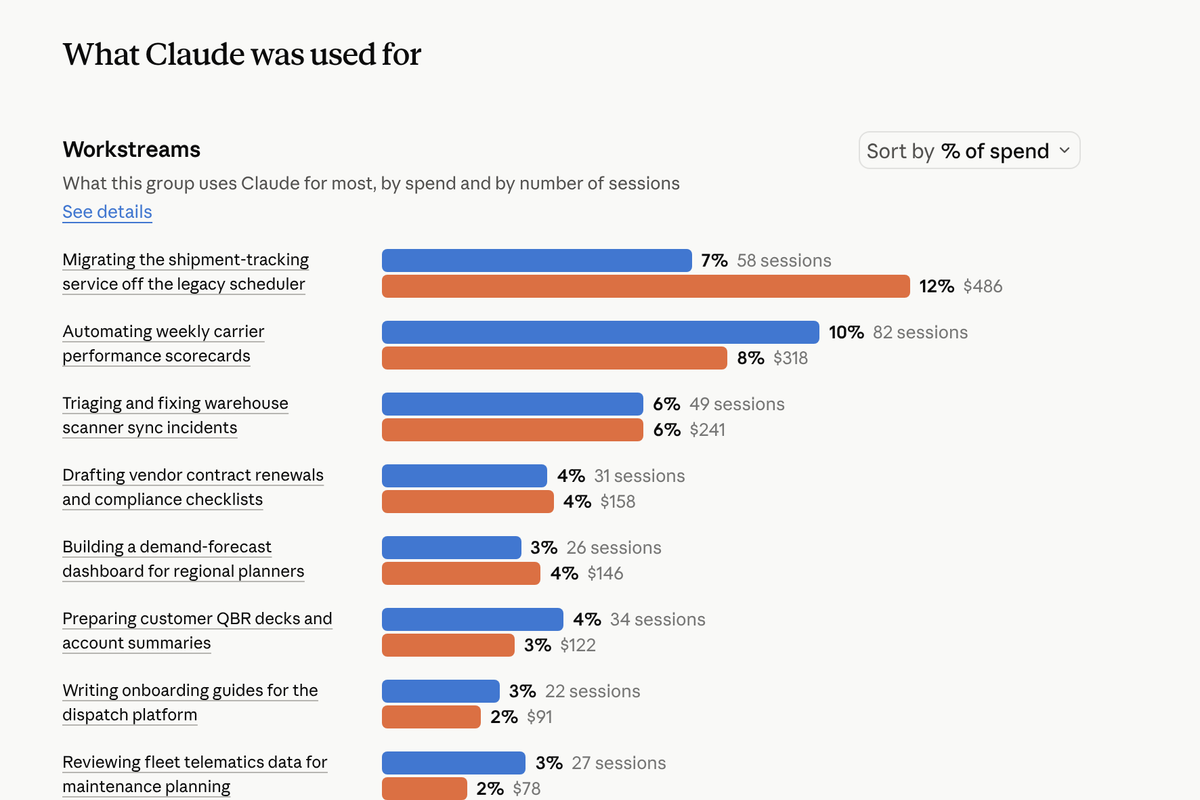
Anthropic's example report: what one team used Claude for, by share of sessions (blue) and share of spend (orange).
- Workstreams: what the team used Claude for, by sessions and by spend.
- Deliverables produced: sessions grouped by output, such as code, research summaries, technical docs and data analysis.
- Cost per session by type of output: average spend per session for each kind of output.
- Task outcomes: what each session produced.
- Most common frictions: blockers by category, such as connector logins, rework loops or missing data.
- Inefficiencies: the count and cost of sessions that produced nothing usable or were off-topic.
- Reusable skills and workflows to build: repeated patterns worth packaging, each with a suggested starting prompt.
- Most expensive sessions: where spend concentrates.
- Complex, autonomous work: the sessions scoring highest on complexity, time saved and run time.
- Answers to custom questions: with the sessions behind each answer.
Three things the example report shows
Anthropic's help article includes an example report for a logistics team. It isn't a real customer, but it shows the patterns worth looking for in your own.
Sessions and spend tell different stories
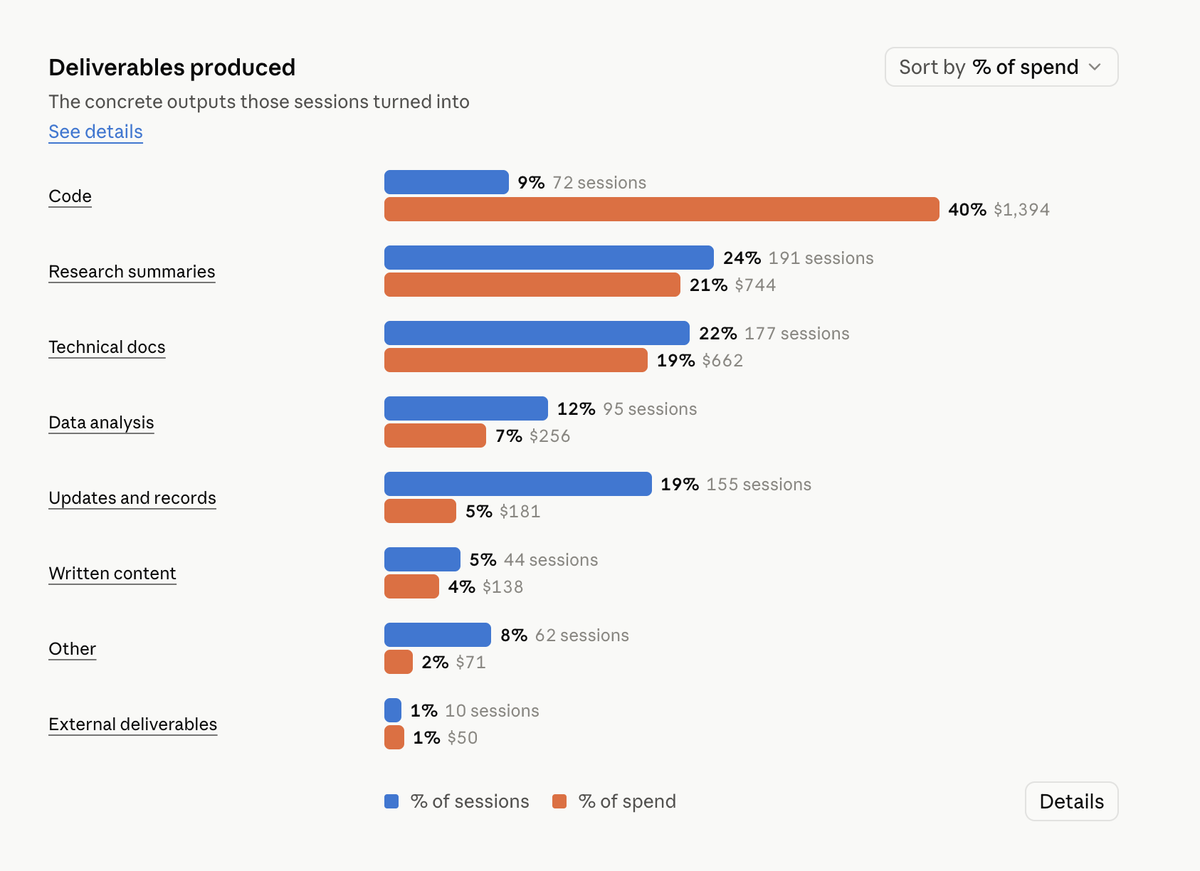
In the example, code was 9% of sessions but 40% of spend. Updates and records were 19% of sessions and only 5% of spend.
Why it matters: split your AI bill by headcount and the people writing status updates subsidise the people running long coding sessions. That may be fine. Most companies just don't know they're doing it.
Spend concentrates
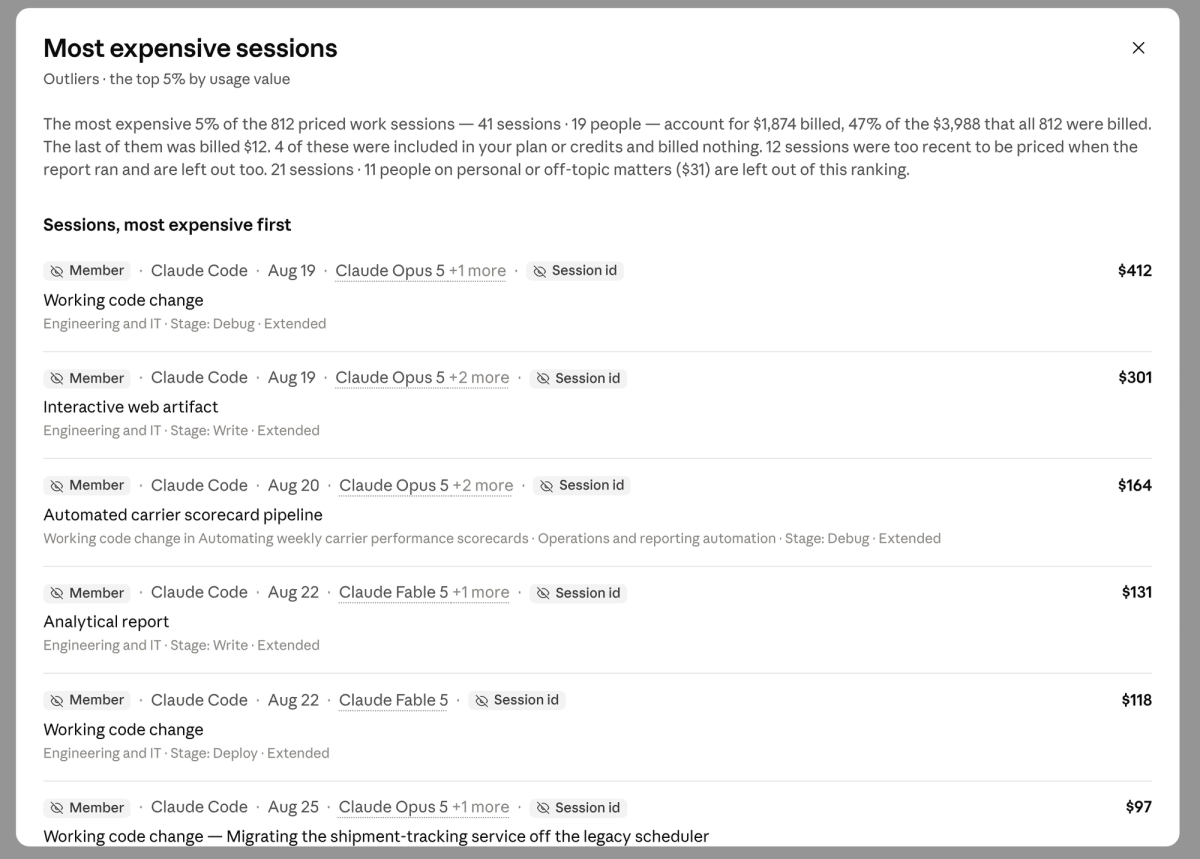
The most expensive 5% of sessions, 41 sessions from 19 people, accounted for 47% of the bill. The single most expensive session, a Claude Code debugging run, cost $412.
That doesn't make those sessions wasteful. A $412 session that ships a migration may be the best money the team spent. But it does mean AI consumption is lumpy, and a flat cost per seat hides where it goes.
Friction is a to-do list
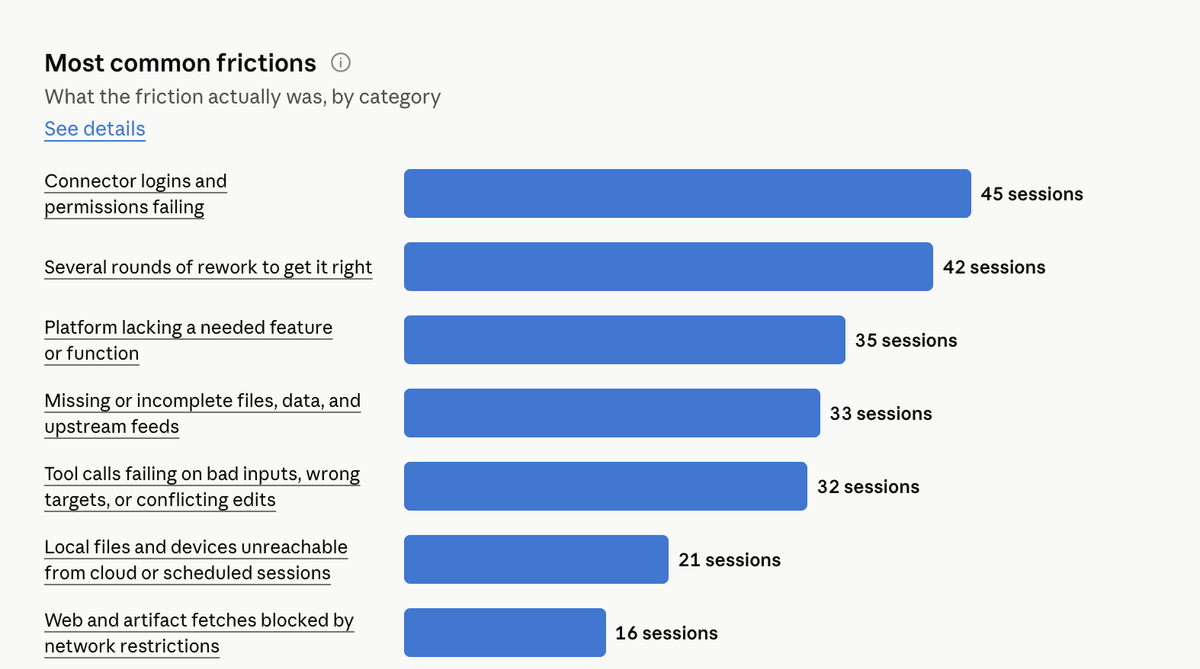
Connector logins failed in 45 sessions. Rework loops showed up in 42. Missing files and data in 33.
Each of those is a support ticket waiting to happen, or a fix you make once for everyone. A connector that fails 45 times is an admin job. Rework 42 times usually means a missing skill: the same instructions typed again and again.
Where it stops
- It samples. Claude reads a sample of sessions, so the numbers are directional. Good for a conversation with a budget owner, not for raising an internal invoice.
- It's a monthly review, not a live meter. Ten reports a month during the beta, each covering up to 28 days.
- Some estates can't use it. It isn't available to organisations using customer-managed encryption keys or HIPAA configurations, or to Claude Code with zero data retention.
- It isn't for judging people. Anthropic says reports are for adoption and investment planning, not performance or employment decisions. Personal conversations never show individual sessions or names, and custom questions can't be asked on restricted topics such as health, union activity or political views.
How we'd use it
- Run one per department, every month, with the same scope, so you can compare like with like.
- Pick one friction and fix it. Then check whether the count falls in next month's report.
- Build one suggested skill. The report hands you the pattern and a starting prompt.
- Show each budget owner their cost. That's showback, and it's where most companies should start. We cover how far to take it in AI showback vs chargeback.
If you need billing-grade numbers, use the spend export in Claude Enterprise usage analytics instead. It breaks spend down per user and per model.
Frequently asked questions
What are Claude smart reports?
A Claude Enterprise feature, in beta, that analyses a sample of a team's sessions and reports what the work was, what it cost, where people hit friction, and which repeated patterns could become shared skills.
Who can run a smart report?
Primary Owners, Owners, Admins and custom roles with analytics access. Delegates can be given access to specific groups, departments or cost centres without becoming admins.
How many smart reports can we run?
Ten free reports per organisation per month during the beta, resetting on the first of each month. Each covers up to the last 28 days. Your account team can arrange more.
Can smart reports be used for chargeback?
Not on their own. They sample transcripts, so the cost figures are directional. Use them for showback, and use the spend export for anything you'd charge to a budget.
Are smart reports a way to monitor individual employees?
No. Anthropic says they're for adoption and investment planning. Personal conversations appear only in aggregate, and names are hidden unless an admin turns on attribution, which logs every reveal.
Next step: watch the replay of our webinar, Show back or charge back?, where we walk through the example report and what to do with it.
Enjoyed this?
Weekly insights for executives navigating enterprise AI. A five-minute read.